7 Steps to Productive Commercial Performance Reviews
Why the QCPR Matters More Than You Think
For operating partners and sales leaders navigating commercial performance challenges inside a portfolio company, the Quarterly Commercial Performance Review (QCPR) is one of the most effective, underutilized tools in the GTM toolkit.
Too often, “commercial” reporting is limited to pipeline commentary or sales quota coverage. But those aren’t strategy, they’re outcomes. The QCPR reorients the conversation to what’s really driving performance: the quality of your GTM engine.
At Mavenray, we’ve built and refined the QCPR as a recurring tool that helps funds and their portfolio leadership understand exactly where to make changes in order to improve retention, accelerate new business, and generate more efficient revenue across the funnel.
It’s not just a slide deck. Done well, a QCPR becomes a *force multiplier* for your go-to-market strategy.
What to Avoid: Don’t Make This a Sales-Only Scorecard
Many mid-market companies, especially ones led by legacy sales cultures, default to making their QCPR all about closing deals. That’s a mistake.
Here’s what happens when you over-focus on bottom-of-funnel activities:
– The pipeline becomes reactive, not proactive.
– You miss opportunities to shape demand earlier in the buyer journey.
– Marketing becomes an order taker, not a growth lever.
– Expansion revenue is left to chance.
A strong GTM strategy *fuels* closing. It doesn’t replace it, but it ensures sales efforts aren’t wasted on poor-fit leads, misaligned messaging, or one-size-fits-all campaigns. GTM makes the funnel work smarter. The QCPR tells you where it’s breaking down.
Your job in a QCPR isn’t to celebrate sales. It’s to engineer repeatable growth.
Step 1: Benchmark the Core Metrics
Start with the data, but tell a story.
Every QCPR begins with a concise snapshot of core growth metrics across key levers:
Retention: Net Revenue Retention (NRR), Gross Revenue Retention (GRR), and churn rate.
Acquisition: New ARR, logo growth, and CAC efficiency.
Expansion: Cross-sell/upsell ARR and customer success metrics.
Sales productivity: ARR per rep, lead source contributions, funnel velocity.
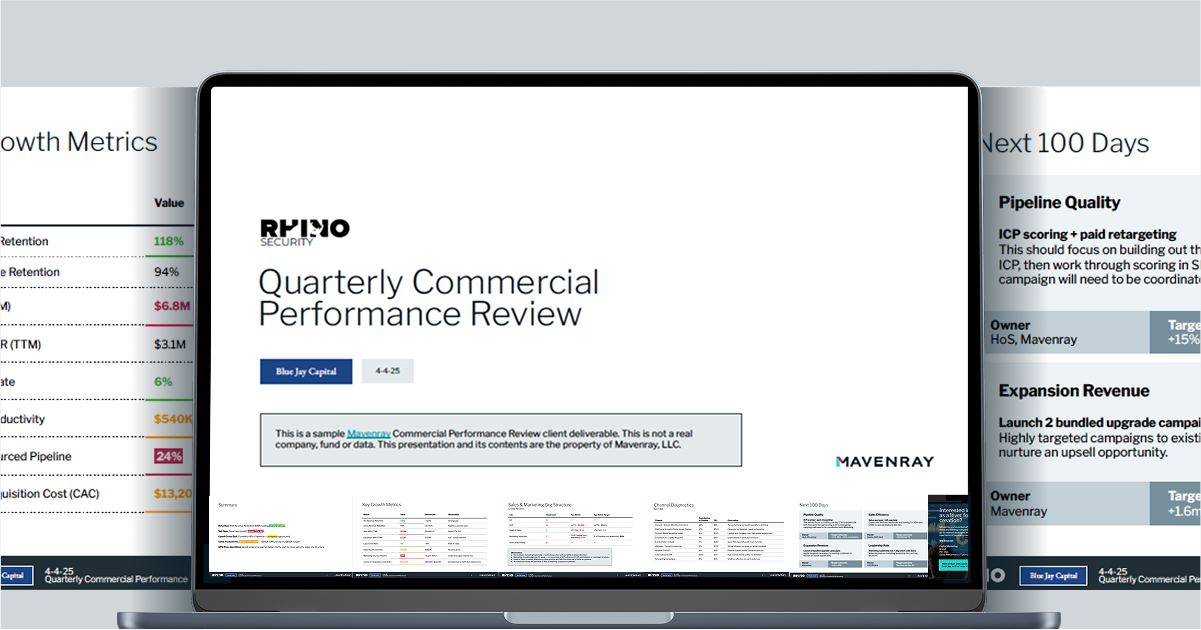
In the Rhino sample, NRR was healthy at 118%, but net-new logos were down 27% year-over-year. Rep productivity sat at $540K, well below the $800K target.
This is where operating partners should pause. Instead of reacting with a “we need more reps” response, ask: *Are we structurally set up to grow efficiently?
Step 1a: If You Don’t Have the Data: Start Small, But Start Smart
Not every portfolio company has a RevOps function or access to clean data. In many mid-market and founder-led businesses, CAC is a guess, MQLs are unscored, and rep productivity lives in a spreadsheet (if at all). That’s okay. This step helps you get moving even if you’re starting from zero.
Here’s how to simplify and still gain traction:
Start With What You *Can* Measure:
– Revenue per Rep (Total bookings ÷ reps)
– % of pipeline sourced by marketing
– Logo churn vs. account growth
– A few recent closed deals, where did they come from?
Prioritize Leading Indicators:
– Time to first conversation
– Win rate of ICP vs. non-ICP customers
– % of sales time spent on poor-fit leads
A “gut check” from the sales team, when guided through structured questions, can surface more truth than a dashboard when dashboards don’t exist.
The Goal: Build Toward RevOps
The QCPR, even in its simplest form, builds the case for a lightweight RevOps function. With each quarter, your metrics sharpen and your execution improves.
Step 2: Diagnose the Funnel: Not Just the Close Rate
The QCPR includes a stage-by-stage funnel analysis: from website leads to MQLs to SQLs to Closed-Won. It forces you to look at conversion rates, not just volume.
In the Rhino case:
– Website traffic was solid, but only 18% converted to MQL (vs. 30% benchmark).
– Sales effort was high, but leads were poor quality.
– No ICP scoring in place.
Before adding pipeline, clean the top. Build ICP scoring, refocus paid spend, and align sales-marketing handoffs.
Step 3: Unpack Channel Performance and CAC
Your QCPR should include a 4Q view of:
– Channel contribution to pipeline
– Cost per lead (CPL)
– Qualitative lead quality
In the Rhino case:
– Cold outbound accounted for 35% of pipeline, but lacked ICP filters.
– Inbound SEO was declining.
– ABM was underused but high quality.
– Paid social costs had spiked.
Channel mix inefficiency inflated CAC. Marketing contributed only 24% of pipeline, too low for healthy scaling.
Step 4: Identify Expansion Gaps
Most teams chase new logos while ignoring expansion. The QCPR helps you catch this blind spot.
Key metrics:
– % of revenue from cross-sell/upsell
– Expansion ARR trends
– CSM capacity + account ratios
– Presence of structured expansion programs
Rhino was missing opportunity:
– Expansion = only 7.8% of total revenue
– 43% of accounts qualified for a targeted upsell
– A bundled campaign could unlock $1.6M ARR
Assign expansion ownership. Launch campaigns. Automate nurture. Free CSMs to pursue revenue.
Step 5: Evaluate Organizational Structure
The QCPR reveals more than performance. It reveals structural gaps:
– No strategic marketing leader?
– Are SDRs closing deals without AE support?
– Does sales own campaign planning?
– Who owns CAC, ICP refinement, channel mix?
In Rhino’s case:
– No AEs or Head of Marketing.
– Sales led marketing execution.
– Sales performance suffered under tactical overload.
Structure matters. You can’t scale without the right people in the right seats.
Step 6: Recommend Targeted GTM Fixes
Strong QCPRs recommend, not just report.
Top recommendations from Rhino’s QCPR:
– ICP scoring + retargeting (+15% MQL–SQL conversion)
– Sales ops + AE coaching (+$100K rep productivity)
– Two targeted upsell campaigns (+$1.6M ARR)
– Marketing leadership decision (within 60 days)
Focus recommendations into a tight 100-day roadmap. Make the outcomes visible and measurable.
Step 7: Align the Fund + Portco on a 100-Day Sprint
The QCPR culminates in a clear execution plan.
Each recommendation should include:
– Owner (Head of Sales, CEO, Mavenray, etc.)
– KPI (e.g., +15% conversion, +$100K/rpFTE)
– Timeline and checkpoint (e.g., Day 60 decision)
This creates cross-functional alignment between fund, CEO, and commercial leadership.
The QCPR becomes a lever to build commercial systems, not just triage results.
Final Thoughts
If you’re an operating partner juggling five underperforming companies or a head of sales in the hot seat with a PE board to answer to. Don’t guess your way through growth. Use the QCPR as your compass.
Done right, it’s not just a report. It’s a roadmap.
Start with benchmarks. Diagnose your funnel. Optimize your channels. Expand what works. Fix what doesn’t. And align leadership around the next 100 days.
This is how commercial excellence gets built, not in one heroic quarter, but in repeatable cycles of clarity and action.
Want help standing up QCPRs across your portfolio? Mavenray offers the structure, training, and executional support to make it happen. Start with a GTM Playbook, and scale from there.